Introduction:
A recent documentary called ‘Autonomous’, directed by popular intellectual Malcolm Gladwell, details our future with self driving cars. Malcolm Gladwell, the best-selling author, is largely responsible for popularizing the case-based approach to non-fiction, in the form of a compendium of quirky essays.
Though not a statistician or a scientist by training, he is summarily rejected by the likes of Daniel Kahneman, a Nobel laureate, as having done a great disservice to the study of psychology and statistics.
To the civically engaged and intelligent non-academic citizen, however, he does hold a certain appeal, as his dialogue is infused with a kind of consciousness. Now that he is squarely in the public eye, he is bound to produce more methodologically sound narratives. Nonetheless, and ‘Autonomous’ is an extensive opinion piece, featuring anecdotal interviews with experts and executives from car companies, and DARPA challenge winners. It raises the question of where we are headed with self-driving cars, discusses their current perception on the automotive industry, and forecasts how further automation will affect motor vehicle safety, and ultimately jobs.
Data:
In light of the documentary, here we will examine the data we currently have on automotive sales. We will use this data to inform the discussion about trends in vehicle purchasing. The data for this analysis comes primarily from the Bureau of Transportation Statistics. Is supplemented with data from the Federal Reserve.
The post is divided into 3 parts.
(a) Car sales
(b) Fatalities and accidents
(c) Means, methods, and infrastructure in place
A commentary can be made on the infrastructure surrounding public highways and public transit in metropolitan areas, by looking at county level commuter data. Resources affecting a commute in turn also affect the job opportunities one can access, and speaks to the work clusters in certain regions of the country. For instance, DC is not just DC, but is in fact DMV. Dallas is no longer just Dallas, but is Dallas-Fort Worth. These regions also doubtless have high connectivity in terms of transportation and are thus better able to facilitate continued growth.
Car Sales (compiled by the Federal Reserve from the BEA):
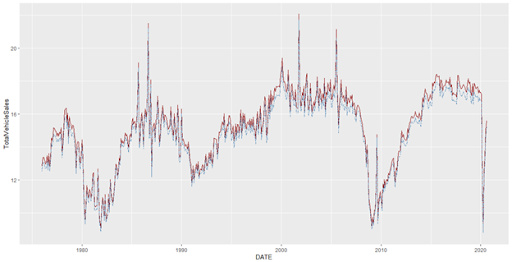
The insights gleaned from the following data are aggregates. Below, I’ve normalized and reproduced graphs readily available in dashboards on the Federal Reserve’s website. The numbers and metrics for each measure are in the millions. However, since we are only interested in observing trends in the data, we scale and normalize the data, to track the direction of the movement.
In the graph below, we see a near congruous relationship between the two linear trends. The two trends are total total vehicular sales, in red, and total lightweight-automotive-vehicle-and-truck sales. This excludes heavyweight trucks. The graph shows us that lightweight auto are driving the bulk of total sales.
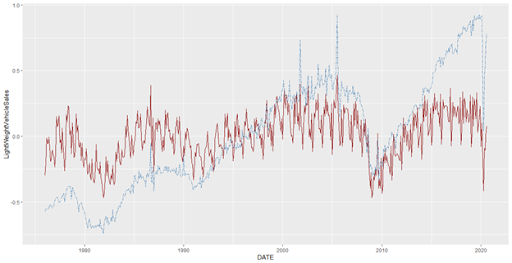
In the next graph, we see a breakdown of the lightweight auto sales. While the red line – lightweight auto sales – does not exhibit much volatility, or expansion beyond it’s current sales patterns, lightweight autos seem to have surged in popularity. Moreover, what is also interesting to note is the marked seasonality present in the light weight auto sales (red line). While it is tough to explain what is driving the incline in lightweight truck sales (dotted blue line) for the past 30 years, it may simply be the fact that they have become so much more compact and efficient than in the past.
FARS Data
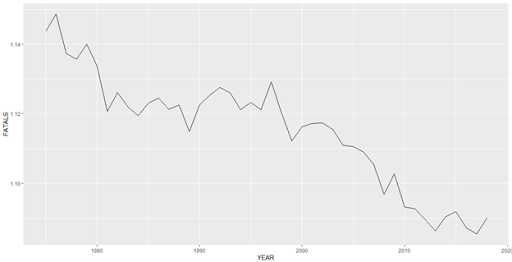
The FARS data come from a comprehensive survey run by the Bureau of Transportation Statistics (BTS), and are based on data from various sources, including death certificates, and coronary reports. Although a bit grim in subject matter, the data tells a better story than we would imagine. Traffic safety has improved overall, the average number of deaths per accident has reduced marginally over time. Because this data is so comprehensive, and somewhat normally distributed, a lot of the collapsed data and means centered around a few numbers – 1 death on average, afternoon time, with 2-3 people in the vehicle. However, breaking out the graph on relevant variables will likely present a more comprehensive picture.
BTS County level data on Commuters:
Lastly, we map county level data according to states. I aggregated or collapsed the data in this dataset to a row for each state, using the means for each column. Importantly, this is cross-sectional data, from 2018. What the graphs below represent are:
(i) average numbers of people in each state commuting outside of their counties for work
(ii) average numbers of people in each state commuting within of their counties for work
(iii) the percentage of people per county using their transit system for commuting
The District of Columbia is an outlier here, as it often is. DC, where state, city, and county all overlap, reflects higher percentages for transit usage.
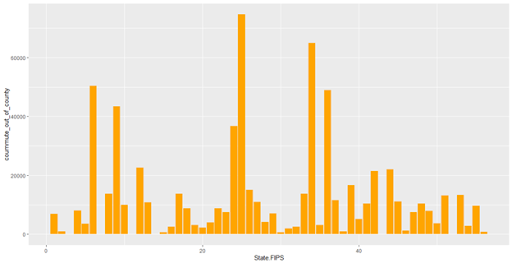
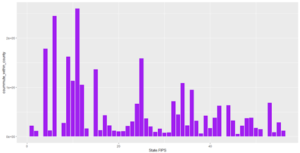
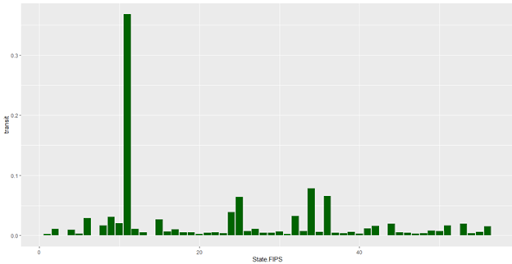
Overall, some interesting findings are discovered from a comparison of graphs i, ii, and iii, and what they can tell us when we overlay them. Without drilling into the labels of specific state and their FIPS codes, we can discern that states with higher cross county commuters (graph i) are somewhat complementary to the states with higher within county commuters (graph ii). However, when we compare the transit graph (graph iii) to the two above graphs, discounting the outlier of DC, we find that it aligns more closely with the cross county commuter graph (graph i).
Conclusion
A preliminary cross graph analysis reveals that the states with a better transit system are more conducive to commuting across counties. Conversely, states with counties that have high numbers of thriving businesses, attracting commuters from across county lines, tend to be more amenable to building thriving transit systems.
In conclusion, our 3 key takeaways are that lightweight truck sales have been increasing over the past 30 years, average fatalities per accident have been declining, and cross county commuter states have better transit systems. It would be all too tempting to link these 3 findings together, but I’ll leave that for another time.